Integrating Relational Databases with Essbase Studio
Because relational databases can store several terabytes of data, they offer nearly unlimited scalability. Multidimensional databases, generally smaller than relational databases, offer sophisticated analytic capabilities. By integrating a relational database with an Essbase database, you leverage the scalability of the relational database with the conceptual power of the multidimensional database.
By default, when Essbase Studio creates an Essbase outline, it loads all member levels specified in the metaoutline into a multidimensional database. You can, however, set Essbase Studio to build to a specified member level (Hybrid Analysis) or build only to the dimension level (Advanced Relational Access). Building down to a specified level produces a smaller multidimensional database and a smaller Essbase outline.
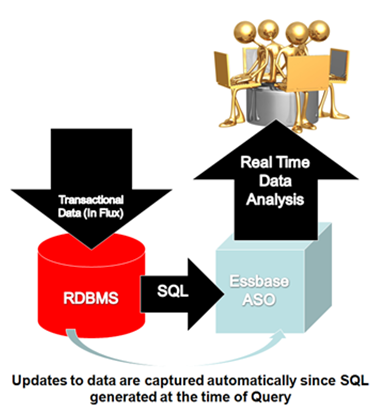
A source relational database can be integrated with an Essbase database by using XOLAP (extended online analytic processing). This is a variation on the role of OLAP in business intelligence. Specifically, XOLAP is an Essbase multidimensional database that stores only the outline metadata and retrieves data from a relational database at query time. XOLAP thus integrates with an Essbase database, leveraging the scalability of the relational database with the more sophisticated analytic capabilities of a multidimensional database.
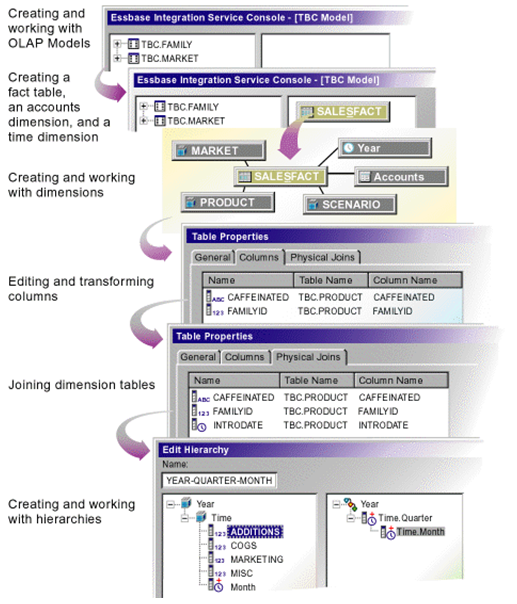
Essbase Studio - Model Development Workflow

Some XOLAP Specifics
- XOLAP (extended online analytic processing) is a variation on the role of OLAP in business intelligence. Specifically, XOLAP is an Essbase multidimensional database that stores only the outline metadata and retrieves data from a relational database at query time. XOLAP thus integrates a source relational database with an Essbase database, leveraging the scalability of the relational database with the more sophisticated analytic capabilities of a multidimensional database.
- OLAP and XOLAP store the metadata outline and the underlying data in different locations:
- In OLAP, the metadata is located in the Essbase database, and the underlying data is also located in the Essbase database.
- In XOLAP, the metadata is located in the Essbase database while the underlying data remains in your source relational database.
- The differences in the locations of the metadata and data are key to understanding how XOLAP can be of benefit because these differences affect the functionality of OLAP and XOLAP.
- OLAP lends itself to traditional relational data storage and data analysis. XOLAP lends itself to operations supported in mixed or "hybrid" environments such as Hybrid Analysis and Advanced Relational Access (familiar to users of Essbase and Essbase Studio). Many of the basic concepts of Hybrid Analysis and Advanced Relational Access have been folded into the functionality of XOLAP cubes in Oracle Essbase Studio.
XOLAP Workflow

The workflow of data retrieval in an XOLAP environment is much like that of a non-XOLAP environment:
- The model is designated as XOLAP-enabled in Essbase Studio.
- The cube is deployed in Essbase Studio; however, no data is loaded at that time.
- The Essbase database is queried, using Smart View, Oracle Essbase Visual Explorer, or another reporting tool which can access an Essbase database.
- Essbase dynamically generates the required SQL to retrieve the data from the source relational database.
Integrating XOLAP with Traditional OLAP Sources

XOLAP has the following restrictions:
- No editing of an XOLAP cube is allowed. If you wish to modify an outline, you must, instead, create a new outline in Oracle Essbase Studio. XOLAP operations will not automatically incorporate any changes in the structures and the contents of the dimension tables after an outline is created.
- When derived text measures are used in cube schemas to build an Essbase model, XOLAP is not available for the model.
- XOLAP can be used only with Aggregate Storage. The database is automatically duplicate-member enabled.
- XOLAP supports dimensions that do not have a corresponding schema-mapping in the catalog; however, in such dimensions, only one member can be a stored member.
Usages Not Supported in XOLAP
XOLAP does not support use of the following:
- Flat files
- Ragged hierarchies
- Alternate hierarchies
- Recursive hierarchies
- Calendar hierarchies
- Filters
- Typed measures
- User defined members at the leaf level
- Multiple relational data sources
Hybrid Analysis
Hybrid Analysis eliminates the need to load and store lower-level members and their data within the Essbase database. This feature gives Essbase the ability to operate with almost no practical limitation on outline size and provides for rapid transfer of data between Essbase databases and relational databases.
Hybrid Analysis integrates a relational database with an Essbase multidimensional database so that applications and reporting tools can retrieve data directly from both databases.
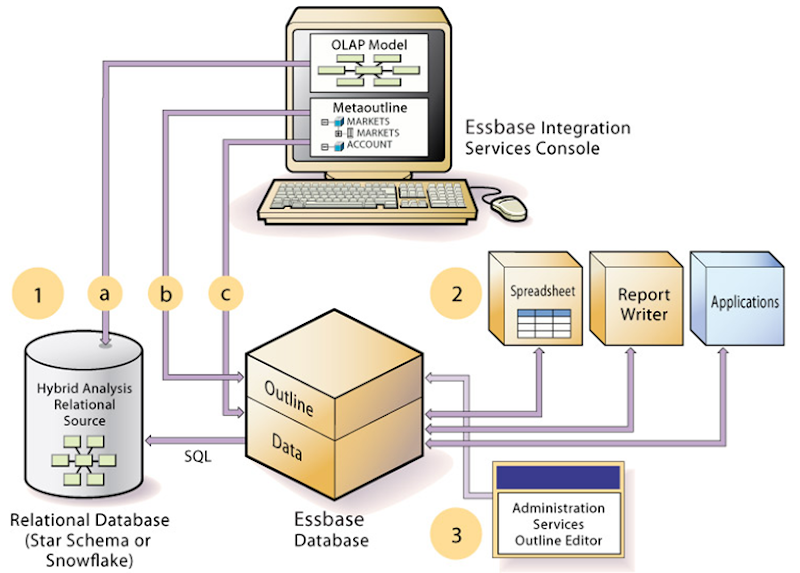
Data Flow for Hybrid Analysis

- The initial step in setting up XOLAP or Hybrid Analysis is to define the relational database as a XOLAP or Hybrid Analysis relational source.
- You define the XOLAP or Hybrid Analysis relational source in Essbase Studio. Through Essbase Studio, you first specify the relational data source for the OLAP model. The OLAP model is a schema that you create from tables and columns in the relational database. To build the model, Essbase Studio accesses the star schema of the relational database. Using the model, you define hierarchies and tag levels whose members are to be enabled for Hybrid Analysis. You then build the metaoutline, a template containing the structure and rules for creating the Essbase outline, down to the desired Hybrid Analysis level. The information enabling Hybrid Analysis is stored in the OLAP Metadata Catalog, which describes the nature, source, location, and type of data in the Hybrid Analysis relational source.
- Next, you perform a member load, which adds dimensions and members to the Essbase outline. At this point XOLAP databases are complete and can queried by a multitude of reporting tolls.
- For Hybrid Analysis databases, when the member load is complete, you must run a data load to populate the Essbase database with data.
- Applications and reporting tools, such as spreadsheets and Report Writer interfaces, can retrieve data directly from both databases using the dimension and member structure defined in the outline, Essbase determines the location of a member and then retrieves data from either the Essbase database or the Hybrid Analysis relational source if a Hybrid Analysis database and from the relational data source when a XOLAP model is specified.
- If the data resides in the Hybrid Analysis relational source, Essbase retrieves it through SQL commands.
- XOLAP also leverages transactional SQL to access data from the fact table at the time the query is initiated by the end user.
- To modify the outline in Hybrid Analysis, you can use Outline Editor in Administration Services to enable or disable dimensions for Hybrid Analysis on an as-needed basis. Changes to metadata in XOLAP require a complete drop and rebuild of the Application and database through Essbase Studio
Comparison of Aggregate and Block Storage
Since XOLAP only supports the Aggregate Storage Kernel, it is pertinent to highlight the differences in ASO and BSO.
Essbase provides an aggregate storage kernel as a persistence mechanism for multidimensional databases. Aggregate storage databases enable dramatic improvements in both database aggregation time and dimensional scalability. The aggregate storage (ASO) kernel is an alternative to the block storage (BSO) kernel. Aggregate storage databases typically address read-only, "rack and stack" applications that have large dimensionality, such as the following applications:
- Customer analysis. Data is analyzed from any dimension, and there are potentially millions of customers.
- Procurement analysis. Many products are tracked across many vendors.
- Logistics analysis. Near real-time updates of product shipments are provided.
Aggregate storage applications, which differ from block storage applications in concept and design, have limitations that do not apply to block storage applications.
Inherent Differences between ASO and BSO
Inherent Differences |
Aggregate Storage |
Block Storage |
|---|
Storage Kernel |
Architecture that supports rapid aggregation, optimized to support high dimensionality and sparse data |
Multiple blocks defined by dense and sparse dimensions and their members, optimized for financial applications |
Physical Data Storage |
Through the Application Properties window, Tablespaces tab in Administration Services |
Through the Database Properties window, Storage tab in Administration Services |
Databases supported per application |
One |
Several (one recommended) |
Outline Differences with ASO and BSO
Outline Functionality |
Aggregate Storage |
Block Storage |
|---|
Multiple hierarchies enabled, dynamic hierarchy, or stored hierarchy designation |
Relevant |
Irrelevant |
Accounts dimensions and members on dynamic hierarchies |
Support with the following exceptions:
• No two-pass calculation
• No association of attribute dimensions with the dimension tagged Accounts
• Additional restrictions for shared members.
|
Full support |
Members on stored hierarchies |
Support with the following exceptions:
• Support for the ~ (no consolidation) operator (underneath label-only members only) and the + (addition) operator
• Cannot have formulas
• Restrictions on label only members
• No Dynamic Time Series members
• Stored hierarchy dimensions cannot have shared members. Stored hierarchies within a multiple hierarchies dimension can have shared members.
|
Full support |
Member storage types |
Support with the following exceptions:
• Dynamic Calc and Store not relevant
• On stored hierarchies, two limitations if a member is label only:
o All dimension members at the same level as the member must be label only
o The parents of the member must be label only.
|
Support for all member storage types in all types of dimensions except attribute dimensions |
Calculation Differences between ASO and BSO
Calculation Functionality
|
Aggregate Storage
|
Block Storage |
|---|
Database calculation |
Aggregation of the database, which can be predefined by defining aggregate views
|
Calculation script or outline consolidation
|
Formulas |
Allowed with the following restrictions:
Must be valid numeric value expressions written in MDX
No support for Essbase calculation functions
On dynamic hierarchy members, formulas are allowed without further restrictions
|
Support for Essbase calculation functions
|
Calculation scripts |
Not supported
|
Supported
|
Attribute calculations dimension |
Support for Sum
|
Support for Sum, Count, Min, Max, and Average
|
Calculation order |
Member formula calculation order can be defined by the user using the solve order member property
|
Defined by the user in the outline consolidation order or in a calculation script
|
Partitioning Differences between ASO and BSO
Partitioning Functionality
|
Aggregate Storage
|
Block Storage
|
|---|
Partitioning
|
Supported with the following restrictions:
No Outline Synchronization
|
Fully supported |
Data Load Differences between ASO and BSO
Data Load Functionality |
Aggregate Storage |
Block Storage |
|---|
Cells loaded through data loads |
Only level 0 cells whose values do not depend on formulas in the outline are loaded |
Cells at all levels can be loaded (except Dynamic Calc members) |
Update of database values |
At the end of a data load, if an aggregation exists, the values in the aggregation are recalculated |
No automatic update of values. To update data values, you must execute all necessary calculation scripts. |
Data load buffers |
The loading of multiple data sources into aggregate storage databases is managed through temporary data load buffers. |
Not supported |
Atomic replacement of the contents of a database |
When loading data into an aggregate storage database, you can replace the contents of the database or the contents of all incremental data slices in the database. |
Not supported |
Data slices |
Aggregate storage databases can contain multiple slices of data. Data slices can be merged. |
Not supported |
Dimension build for shared members |
Full support for parent-child build method. Duplicate generation (DUPGEN) build method limited to building alternate hierarchies up to generation 2 (DUPGEN2). |
Support for all build methods |
Loading data mapped to dates |
In a date-time dimension, you can load data into level-0 members using supported date-format strings instead of member names. |
Date-time dimension type is not supported. |
Query Differences between ASO and BSO
Query Functionality |
Aggregate Storage |
Block Storage |
|---|
Report Writer |
Supported, except for commands related to sparsity and density of data |
Fully supported |
Spreadsheet Add-in |
Supported, with limited ability to change data (write-back) |
Fully supported |
API |
Supported |
Supported |
Export |
Support with the following restrictions:
• Export of level 0 data only (no upper-level export)
• No columnar export
|
Supported |
MDX queries |
Supported |
Supported |
Queries on attribute members that are associated with non-level 0 members |
Returns values for descendants of the non-level 0 member. |
Returns missing for descendants of the non-level 0 member |
Queries on attribute members and shared members |
A shared member automatically shares the attribute associations of its nonshared member |
A shared member does not share the attribute associations of its nonshared member |
Query logging |
Not Supported |
Supported |
Query performance |
Considerations when querying data from a dimension that has multiple hierarchies. |
Hierarchies not relevant |
Feature Differences between ASO and BSO
Featues |
Aggregate Storage |
Block Storage |
|---|
Aliases |
Supported |
Supported |
Currency Conversion |
Not Supported |
Supported |
Data Mining |
Not Supported |
Supported |
Hybrid Analysis |
Support with the following restriction: queries that contain a relational member and an Essbase member with a formula in the same query are not supported. |
Supported |
Incremental Data Load |
Supported |
Supported |
LROs |
Not Supported |
Supported |
Time Balance Reporting |
Support with the following restrictions:
• Skip Zeros is not supported
• Time dimension must contain at least one stored hierarchy
• Shared members must be at level zero
|
Supported |
Triggers |
After-update triggers supported |
On-update triggers and after-update triggers supported |
Unicode |
Supported |
Supported |
Variance Reporting |
Not Supported |
Supported |
Date-time dimension type and linked attribute dimensions |
Supported |
Not Supported |
User ability to change data (write-back) |
Transparent partition technique used to enable limited write-back |
Fully Supported |
Links to Blogs written by BICG on XOLAP
Part 1 of the XOLAP blog
http://oraclebiblog.blogspot.com/2010/02/xolap-virtual-cubes-against-data.html
Part 2 of the XOLAP blog
http://oraclebiblog.blogspot.com/2010/02/xolap-virtual-cubes-against-data_15.html


