OracleBIBlog Search

Monday, December 27, 2010

Three dashboard ideas for finance executives, a good read for those thinking of their organization’s strategy for the coming year…

On this holiday week I decided to dedicate this post to giving some thought to the challenges leaders of finance organizations face and to looking at them in terms of coming up with a short list of indicators that can be leveraged as they reflect on the ways to shape their team’s strategy in a way that maximizes their contribution and impact on the company this soon to come new year.

To keep things simple and avoid taking too much of your holiday time this post focuses on three dashboard ideas that align values and traits of high performance teams and that are built in response to governance and strategic challenges common to many financial organizations.

These dashboards can be easily implemented with Oracle Business Intelligence or other similar reporting tool. My recommendation is to have the first iteration of your dashboard be as simple and concise as possible and build upon it as your needs and processes evolve.

Discipline (IRR)

One of the organizational values that are hardest to measure is the discipline that your overall organization exhibits when making strategic decisions. Measuring the return on capital allocations is a process common in large conglomerates that isn’t always transparent or free of political maneuvering.

Deploying a simple dashboard that tracks the progress of large strategic projects in terms of both schedule and actual versus budgeted costs allows the office of the CFO to educate executives and managers in other areas on financial methodologies such as calculating the Internal Rate of Return (IRR) of a project or estimating the Total Cost of Ownership of a piece of equipment.

Having a dashboard with Key Performance Indicators that measure the rate of return, and actual versus projected performance in terms of cost and schedule will help your organization bring more transparency to the process of deciding which projects will be funded and will help your counterparts in other areas of the business in improving their financial decision making skills.

­­­­­Efficiency (Time To Close)

One other function that usually resides with the finance organization is the process of closing the books and preparing financial and management reports. This process which is, for the most part, simple and repetitive is implemented and managed very differently from company to company. These differences are often a result of industry specific accounting and differences in management style.

The best way to save your staff late nights and weekends while delivering analysis and reports to your management faster might be as unorthodox and simple as breaking your closing process in the different tasks that compose it and tracking the time each of them takes to complete each month. You can start simply by writing the list on a white board and later on make the transition to a dashboard page that can be shared with all of your team.

By understanding which components of your closing process take the most effort from your team you gain great visibility and thinker with the processes to shorten your cycle time. There have been corporations that implement daily reconciliation of their accounts therefore gaining the ability to detect unusual account activity much faster than if they had to wait for the bank statements to arrive in the mail.

You can use the data in your closing cycle dashboard as a development opportunity for your staff by encouraging them to detect processes that exhibit a lot of variance from month to month and coming up with ways to proactively eliminate the causes of this variance.

Value Creation

With the economy signaling it is finally turning around towards recovery and finance and accounting staff job satisfaction at the lowest level in years it is time to identify top performers and give them opportunities to feel challenged and excel.

It is in the best interest of finance leaders to create opportunities for their staff to get out of the routine of their day to day work and go work in teams within other functional areas of the organization by providing them with internal consulting on financial management and compliance best practices. This aligns very closely with the first dashboard idea, your staff can provide training and consulting to teams working on strategic projects being tracked on the IRR/Projects dashboard.

The value created by these select members of your team can be tracked by the number of projects they are consulting for and the number of training and consulting hours they provide to other areas of your organization. This in turn can be used as a tool in the justification of any proactive compensation activity you might decide to undertake as you try to retain high performing employees in your team.

Conclusion

When planning your finance organization’s strategy for the year that is about to begin you can use the dashboard ideas in this article as tools that will allow you to communicate to your staff and to other functional areas and fellow executives what improvement is being made in the internal processes of your area and; most important, how is it that your team can be engaged as a partner in value creation.

Please send your feedback and comments to Ignacio.delaTorre@biconsultinggroup.com, I’ll be very interested to hear your opinion and any additional ideas that might be useful to others reading this article.

Tuesday, December 7, 2010

Integrating Relational Databases with Essbase Studio

Integrating Relational Databases with Essbase Studio


Because relational databases can store several terabytes of data, they offer nearly unlimited scalability. Multidimensional databases, generally smaller than relational databases, offer sophisticated analytic capabilities. By integrating a relational database with an Essbase database, you leverage the scalability of the relational database with the conceptual power of the multidimensional database.


By default, when Essbase Studio creates an Essbase outline, it loads all member levels specified in the metaoutline into a multidimensional database. You can, however, set Essbase Studio to build to a specified member level (Hybrid Analysis) or build only to the dimension level (Advanced Relational Access). Building down to a specified level produces a smaller multidimensional database and a smaller Essbase outline.


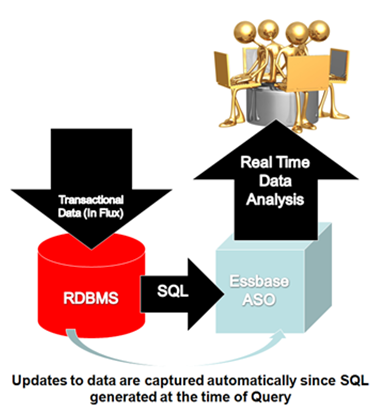
A source relational database can be integrated with an Essbase database by using XOLAP (extended online analytic processing). This is a variation on the role of OLAP in business intelligence. Specifically, XOLAP is an Essbase multidimensional database that stores only the outline metadata and retrieves data from a relational database at query time. XOLAP thus integrates with an Essbase database, leveraging the scalability of the relational database with the more sophisticated analytic capabilities of a multidimensional database.


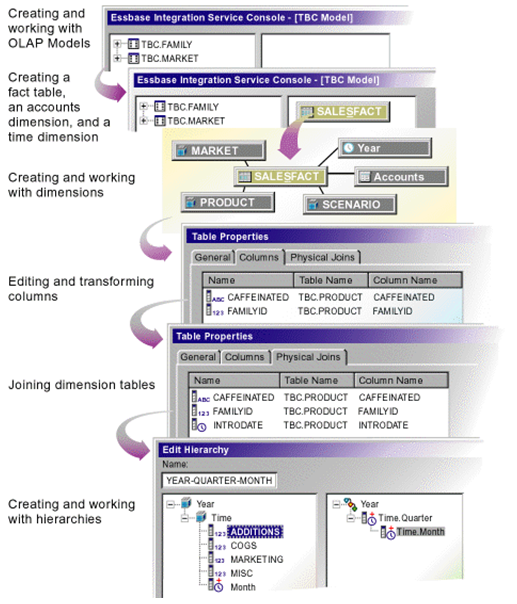
Essbase Studio - Model Development Workflow


Some XOLAP Specifics


  • XOLAP (extended online analytic processing) is a variation on the role of OLAP in business intelligence. Specifically, XOLAP is an Essbase multidimensional database that stores only the outline metadata and retrieves data from a relational database at query time. XOLAP thus integrates a source relational database with an Essbase database, leveraging the scalability of the relational database with the more sophisticated analytic capabilities of a multidimensional database.

  • OLAP and XOLAP store the metadata outline and the underlying data in different locations:


    • In OLAP, the metadata is located in the Essbase database, and the underlying data is also located in the Essbase database.

    • In XOLAP, the metadata is located in the Essbase database while the underlying data remains in your source relational database.


  • The differences in the locations of the metadata and data are key to understanding how XOLAP can be of benefit because these differences affect the functionality of OLAP and XOLAP.

  • OLAP lends itself to traditional relational data storage and data analysis. XOLAP lends itself to operations supported in mixed or "hybrid" environments such as Hybrid Analysis and Advanced Relational Access (familiar to users of Essbase and Essbase Studio). Many of the basic concepts of Hybrid Analysis and Advanced Relational Access have been folded into the functionality of XOLAP cubes in Oracle Essbase Studio.


XOLAP Workflow


The workflow of data retrieval in an XOLAP environment is much like that of a non-XOLAP environment:


  1. The model is designated as XOLAP-enabled in Essbase Studio.

  2. The cube is deployed in Essbase Studio; however, no data is loaded at that time.

  3. The Essbase database is queried, using Smart View, Oracle Essbase Visual Explorer, or another reporting tool which can access an Essbase database.

  4. Essbase dynamically generates the required SQL to retrieve the data from the source relational database.


Integrating XOLAP with Traditional OLAP Sources


XOLAP has the following restrictions:


  1. No editing of an XOLAP cube is allowed. If you wish to modify an outline, you must, instead, create a new outline in Oracle Essbase Studio. XOLAP operations will not automatically incorporate any changes in the structures and the contents of the dimension tables after an outline is created.

  2. When derived text measures are used in cube schemas to build an Essbase model, XOLAP is not available for the model.

  3. XOLAP can be used only with Aggregate Storage. The database is automatically duplicate-member enabled.

  4. XOLAP supports dimensions that do not have a corresponding schema-mapping in the catalog; however, in such dimensions, only one member can be a stored member.


Usages Not Supported in XOLAP


XOLAP does not support use of the following:


  • Flat files

  • Ragged hierarchies

  • Alternate hierarchies

  • Recursive hierarchies

  • Calendar hierarchies

  • Filters

  • Typed measures

  • User defined members at the leaf level

  • Multiple relational data sources


Hybrid Analysis


Hybrid Analysis eliminates the need to load and store lower-level members and their data within the Essbase database. This feature gives Essbase the ability to operate with almost no practical limitation on outline size and provides for rapid transfer of data between Essbase databases and relational databases.


Hybrid Analysis integrates a relational database with an Essbase multidimensional database so that applications and reporting tools can retrieve data directly from both databases.


Data Flow for Hybrid Analysis


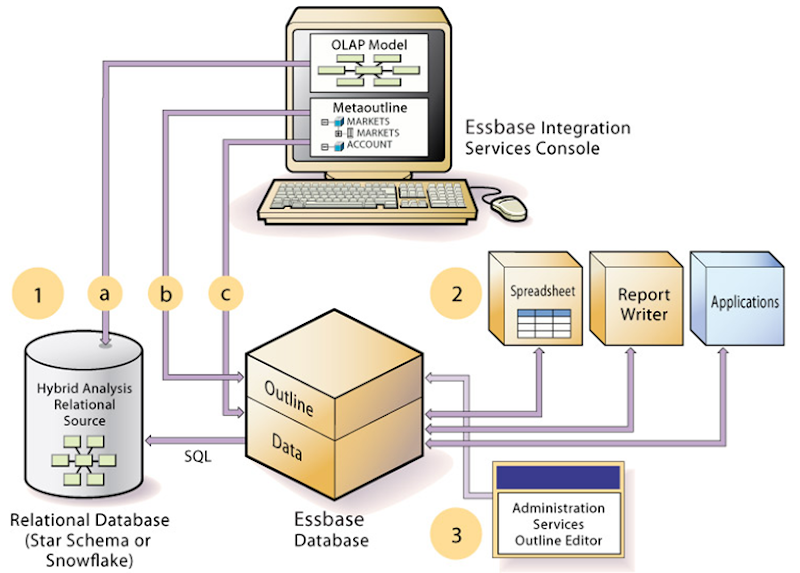
  • The initial step in setting up XOLAP or Hybrid Analysis is to define the relational database as a XOLAP or Hybrid Analysis relational source.


  1. You define the XOLAP or Hybrid Analysis relational source in Essbase Studio. Through Essbase Studio, you first specify the relational data source for the OLAP model. The OLAP model is a schema that you create from tables and columns in the relational database. To build the model, Essbase Studio accesses the star schema of the relational database. Using the model, you define hierarchies and tag levels whose members are to be enabled for Hybrid Analysis. You then build the metaoutline, a template containing the structure and rules for creating the Essbase outline, down to the desired Hybrid Analysis level. The information enabling Hybrid Analysis is stored in the OLAP Metadata Catalog, which describes the nature, source, location, and type of data in the Hybrid Analysis relational source.

  2. Next, you perform a member load, which adds dimensions and members to the Essbase outline. At this point XOLAP databases are complete and can queried by a multitude of reporting tolls.

  3. For Hybrid Analysis databases, when the member load is complete, you must run a data load to populate the Essbase database with data.


  • Applications and reporting tools, such as spreadsheets and Report Writer interfaces, can retrieve data directly from both databases using the dimension and member structure defined in the outline, Essbase determines the location of a member and then retrieves data from either the Essbase database or the Hybrid Analysis relational source if a Hybrid Analysis database and from the relational data source when a XOLAP model is specified.


    • If the data resides in the Hybrid Analysis relational source, Essbase retrieves it through SQL commands.

    • XOLAP also leverages transactional SQL to access data from the fact table at the time the query is initiated by the end user.


  • To modify the outline in Hybrid Analysis, you can use Outline Editor in Administration Services to enable or disable dimensions for Hybrid Analysis on an as-needed basis. Changes to metadata in XOLAP require a complete drop and rebuild of the Application and database through Essbase Studio


Comparison of Aggregate and Block Storage


Since XOLAP only supports the Aggregate Storage Kernel, it is pertinent to highlight the differences in ASO and BSO.


Essbase provides an aggregate storage kernel as a persistence mechanism for multidimensional databases. Aggregate storage databases enable dramatic improvements in both database aggregation time and dimensional scalability. The aggregate storage (ASO) kernel is an alternative to the block storage (BSO) kernel. Aggregate storage databases typically address read-only, "rack and stack" applications that have large dimensionality, such as the following applications:


  • Customer analysis. Data is analyzed from any dimension, and there are potentially millions of customers.

  • Procurement analysis. Many products are tracked across many vendors.

  • Logistics analysis. Near real-time updates of product shipments are provided.


Aggregate storage applications, which differ from block storage applications in concept and design, have limitations that do not apply to block storage applications.


Inherent Differences between ASO and BSO


Inherent DifferencesAggregate StorageBlock Storage
Storage KernelArchitecture that supports rapid aggregation, optimized to support high dimensionality and sparse dataMultiple blocks defined by dense and sparse dimensions and their members, optimized for financial applications
Physical Data StorageThrough the Application Properties window, Tablespaces tab in Administration ServicesThrough the Database Properties window, Storage tab in Administration Services
Databases supported per applicationOneSeveral (one recommended)

Outline Differences with ASO and BSO


Outline FunctionalityAggregate StorageBlock Storage
Multiple hierarchies enabled, dynamic hierarchy, or stored hierarchy designationRelevantIrrelevant
Accounts dimensions and members on dynamic hierarchies

Support with the following exceptions:


• No two-pass calculation


• No association of attribute dimensions with the dimension tagged Accounts


• Additional restrictions for shared members.


Full support
Members on stored hierarchies

Support with the following exceptions:


• Support for the ~ (no consolidation) operator (underneath label-only members only) and the + (addition) operator


• Cannot have formulas


• Restrictions on label only members


• No Dynamic Time Series members


• Stored hierarchy dimensions cannot have shared members. Stored hierarchies within a multiple hierarchies dimension can have shared members.


Full support
Member storage types

Support with the following exceptions:


• Dynamic Calc and Store not relevant


• On stored hierarchies, two limitations if a member is label only:


o All dimension members at the same level as the member must be label only


o The parents of the member must be label only.


Support for all member storage types in all types of dimensions except attribute dimensions

Calculation Differences between ASO and BSO


Calculation Functionality


Aggregate Storage


Block Storage
Database calculation

Aggregation of the database, which can be predefined by defining aggregate views


Calculation script or outline consolidation


Formulas

Allowed with the following restrictions:


Must be valid numeric value expressions written in MDX


No support for Essbase calculation functions


On dynamic hierarchy members, formulas are allowed without further restrictions


Support for Essbase calculation functions


Calculation scripts

Not supported


Supported


Attribute calculations dimension

Support for Sum


Support for Sum, Count, Min, Max, and Average


Calculation order

Member formula calculation order can be defined by the user using the solve order member property


Defined by the user in the outline consolidation order or in a calculation script


Partitioning Differences between ASO and BSO


Partitioning Functionality


Aggregate Storage


Block Storage


Partitioning


Supported with the following restrictions:


No Outline Synchronization


Fully supported

Data Load Differences between ASO and BSO


Data Load FunctionalityAggregate StorageBlock Storage
Cells loaded through data loadsOnly level 0 cells whose values do not depend on formulas in the outline are loadedCells at all levels can be loaded (except Dynamic Calc members)
Update of database valuesAt the end of a data load, if an aggregation exists, the values in the aggregation are recalculatedNo automatic update of values. To update data values, you must execute all necessary calculation scripts.
Data load buffersThe loading of multiple data sources into aggregate storage databases is managed through temporary data load buffers.Not supported
Atomic replacement of the contents of a databaseWhen loading data into an aggregate storage database, you can replace the contents of the database or the contents of all incremental data slices in the database.Not supported
Data slicesAggregate storage databases can contain multiple slices of data. Data slices can be merged.Not supported
Dimension build for shared membersFull support for parent-child build method. Duplicate generation (DUPGEN) build method limited to building alternate hierarchies up to generation 2 (DUPGEN2).Support for all build methods
Loading data mapped to datesIn a date-time dimension, you can load data into level-0 members using supported date-format strings instead of member names.Date-time dimension type is not supported.

Query Differences between ASO and BSO


Query FunctionalityAggregate StorageBlock Storage
Report WriterSupported, except for commands related to sparsity and density of dataFully supported
Spreadsheet Add-inSupported, with limited ability to change data (write-back)Fully supported
APISupportedSupported
Export

Support with the following restrictions:


• Export of level 0 data only (no upper-level export)


• No columnar export


Supported
MDX queriesSupportedSupported
Queries on attribute members that are associated with non-level 0 membersReturns values for descendants of the non-level 0 member.Returns missing for descendants of the non-level 0 member
Queries on attribute members and shared membersA shared member automatically shares the attribute associations of its nonshared memberA shared member does not share the attribute associations of its nonshared member
Query loggingNot SupportedSupported
Query performanceConsiderations when querying data from a dimension that has multiple hierarchies.Hierarchies not relevant

Feature Differences between ASO and BSO


FeatuesAggregate StorageBlock Storage
AliasesSupportedSupported
Currency ConversionNot SupportedSupported
Data MiningNot SupportedSupported
Hybrid AnalysisSupport with the following restriction: queries that contain a relational member and an Essbase member with a formula in the same query are not supported.Supported
Incremental Data LoadSupportedSupported
LROsNot SupportedSupported
Time Balance Reporting

Support with the following restrictions:


• Skip Zeros is not supported


• Time dimension must contain at least one stored hierarchy


• Shared members must be at level zero


Supported
TriggersAfter-update triggers supportedOn-update triggers and after-update triggers supported
UnicodeSupportedSupported
Variance ReportingNot SupportedSupported
Date-time dimension type and linked attribute dimensionsSupportedNot Supported
User ability to change data (write-back)Transparent partition technique used to enable limited write-backFully Supported

Links to Blogs written by BICG on XOLAP


Part 1 of the XOLAP blog


http://oraclebiblog.blogspot.com/2010/02/xolap-virtual-cubes-against-data.html


Part 2 of the XOLAP blog


http://oraclebiblog.blogspot.com/2010/02/xolap-virtual-cubes-against-data_15.html

Friday, December 3, 2010

OBI 11G Fusion Middleware Control (EM)

Fusion Middleware Control:
The Fusion Middleware Control console is used to monitor and start/stop various OBI components. It is located on the application server at http://localhost:7001/em. Much of the configuration of OBI that used to be done in the NQSConfig.ini files can now be done using this front end console, which in turns updates the NQSConfig.ini file. Things in the NQSConfig.ini file that are set by EM are noted in the file with '# This Configuration setting is managed by Oracle Business Intelligence Enterprise Manager'. The only thing I noticed that needs to be setup manually in the NQSConfig.ini file are:

1. Usage Tracking
2. Dynamic Libraries
3. Query Optimization Flags
4. MDX Member Name Cache Section (SAP BW)
5. More specific General Settings where EM doesn't contain the level of detail required

The Fusion Middleware Control EM console has five tabs to manage the application. From the domain tree, expand Business Intelligence and click coreapplication as shown below.


Overview:
This view shows system status, and allows you to start/stop the system. The other tabs allow you to further configure the application.


Capacity Management:
This view has four tabs:

-Metrics: This gives metrics on request response time, load and query errors. You once might have looked at Usage Tracking for this information.

-Availability: Shows current availability of all components, allowing you to start/stop them. Also includes 'Point of Failure' analysis which shows areas in the infrastructure likely to fail when a hardware/software failure occurs.

-Scalability: This tab lets you enable Verticle Clustering, increasing the amount of instances of OBI on a server.

-Performance: Used for cache management, including settings that would have been set in NQSConfig.ini in 10g. It manages user query response time and max rows returned, settings that were set in InstanceConfig.xml.


Diagnostics:

This view has 2 tabs. One for server log messages, and the other for log file settings. These used to be kept in the RPD and the NQSServer.log.


Security:
This view allows you to enable SSO. Also links to Weblogic Admin Console Security realm to manage Weblogic security.


Deployment:
This section is for managing the deployment of various aspects of OBI 11G.

-Presentation: Contains a few settings for Dashboard and Analysis defaults. These used to be managed on a less global scale through Manage Privileges.

-Repository: This is where the RPD and Presentation Services are managed, and shared between servers for horizontal clustering.

-Scheduler: Schema connection information for the scheduler tables

-Marketing: For Siebel Marketing connection

-Mail: Scheduler mail server connection information

Saturday, November 27, 2010

OBIEE 11g, Opening Ports on Oracle Linux - How-To Video

Working with OBIEE 11g on Oracle Enterprise Linux (OEL), with or without the Unbreakable Kernel, one will need to open up several trusted ports as the firewall is turned on by default. Clearly, the best practice is too keep the firewall in-tact and enabled but for extra ports that are needed to access the OBI server environment. Configuring such access is straightforward. The video below takes an informal look at accomplishing opening ports using the OEL graphical user interface. This approach is great for a development or test environment but it is not recommended for a production environment.


The OBI 11g ports that are essential to open are:
  • 9704 - Presentation Services
  • 9703 - BI Server (Administration tool DSN access)
  • 7001 - WebLogic Server (Administration Console)

This video is part of a series of video blog posts on installing and configuring OBIEE 11g.

Friday, November 26, 2010

OBIEE 11g, Setup Client DSN for Administration Tool - How-To Video

After installing the OBI 11g client tools each OBI developer or administrator will need to access the Oracle BI RPD using the OBI Administration Tool. The Administration Tool is the GUI that connects to the Oracle BI Server RPD in Online mode (or on the network in offline mode) allowing development and administration functionality of the RPD. The informal video below highlights the process in which to create an ODBC data source connection to the Oracle BI server and test that the connectivity is working.


This video how-to makes the assumption that the client workstation already has the OBI 11g binaries installed on the machine from any of the install options via the OBI11g installer.

This video is part of a series of videos on OBI 11g installation and configuration.

Tuesday, November 23, 2010

OBIEE 11g Certification Available

Oracle tends to work hard to ensure that best practices are adhered to when working with their products. They even go as far to offer certifications which acknowledge one's ability to demonstrate product knowledge and acuity for implementing, developing, etc. with Oracle products. The release of OBIEE 11g is no exception, and Oracle has recently released the OBI 11g Certification Exam for those so inclined and ready to be stamped as an OBI 11g guru.

This certification holds some similar exam topics to that of its predecessor certification exam for the 10.1.3.x OBI version. But clearly with OBI 11g there are many new areas on which to be tested. Reading over the OBI 11g Exam certification topics one can get a good feel for what Oracle thinks are "must have" areas within the new application to focus on. Even if not taking the exam, learning these topics should provide an administrator, developer, or super-user with keen insight to working with and implementing OBI 11g.

The OB 11g Oracle certification is currently only available for Oracle partners. However, whether you gearing up for the OBI 11g exam or just needing to get educated on OBI 11g, BI Consulting Group has already released several OBI 11g training courses via their BICG University education center on the following topics:

# OBIEE 11-301: Dashboard/Report Application Development
# OBIEE 11-401: Repository/Metadata App Dev
# OBIEE 11-402: Server Architecture

In conclusion, I have always been a fan of official certifications as they show that one took the initiative to learn the information, was grilled on that information via examination, and knew the material well enough to achieve certification status. To me, this is only one or two steps below taking the time to write a book on the topic in question - guru status.

Do you think Oracle certifications are worthwhile?
How has an Oracle certification the helped you in the past?
Should Oracle offer a public OBI 11g certification?

Monday, November 22, 2010

Easy Download Link

When setting up a navigation from a report on a dashboard to a target report (not on a dashboard), one of the pieces missing and most asked for is a download link. To provide it, follow these simple steps.

1. Open the report that should contain the download link
2. Add a static text view to the compound view

3. Check the "Contains HTML Markup" checkbox
4. Type:


5. Click the "Display Results" link to verify it is working then click ok
6. Test it

Syntax:
http://virtualxp:9704/analytics/saw.dll? - the path to the BI Server (typically /analytics/saw.dll is all that is needed)
Download - the action to perform (other actions include Go and Navigate, not covered in this post, maybe next time)
&Format=excel - the format of the download
&Extension=.xls - the extension of the file (the report name will be the file name)
path=/users/administrator/Target%20Report - the path to the report

The path to the report can be found in the address bar.
If you are manually typing it in or providing it through a column value, don't forget to replace spaces, quotes, and other special characters with their HTML equivalents.

Other valid formats and extensions:
CSV - &Format=txt&Extension=.csv
PPT - &Format=powerpoint
Excel 2000 - &Format=excel2000&Extension=.xls
HTML - &Format=mht

Friday, November 19, 2010

An OBI 11g Client Tools Only Install Work-Around

OBI 11g has been out for several months now and it is getting great reviews - As it should! It is a clean and powerful upgrade from its 10g predecessor. With that being said, many things have changed, not only from a graphical end-user perspective but from a foundation and architecture one as well. This post is specifically discussing the later. Even more specifically, this post touches on what is probably the loudest complaint of System Integrators thus far which is that OBI 11g does not have a client tools install like OBI 10g did. What does this mean OBI 11g integrators and developers? It means that basically anytime one needs to leverage the Administration Tool, Catalog Manager, etc. on a client workstation (away from the OBI Server, i.e.: client/server interaction) the workstation must be loaded with all binaries and configurations as if it was to be the OBI 11g server itself. Oracle's documentation goes on to say that after a full install (Simple or Enterprise) on a client workstation (Windows only, of course) that one must shutdown and disable all server related Windows Services. Clearly this is cumbersome to say the least just to get client tools loaded.

To workaround this one can conduct the OBI 11g installation on a certified client OS using the Software Only Install option. This option requires that a Fusion Middleware Home already be established. So, WebLogic 10.3.3 must be installed on the client machine prior to conducting the OBI 11g Software Only installation. You may download from here or from the Oracle e-delivery site.

If you attempt to conduct the software only install without prior installation of the WebLogic Server you will be confronted with the following error messages (INST-07407, INST-07247):


Once the WebLogic Server has been installed on the client OS, install OBI 11g using the Software Only option. The installation should complete without incident as only the binaries are installed on the client machine. Once the install completes, navigate to the administration tool executable now under the path <fmw_home>\Oracle_BI1\bifoundation\server\bin\admintool.exe.

Please note that the administration tool and all OBIEE 11g client tools are certified to run on a 32-bit OS only. Be warned that the client tools will install onto a 64-bit machine but Oracle currently will not support that version OS if something goes wrong. Please see this link for the current OBI 11g certification matrix, here (OBI 11g Release 1) or here for the full Full Fusion Middleware Certification Matrices. Take note that this is an OBI 11g Client Tools Only Install Work-Around and it is not-officially supported by Oracle But, it is much more efficient than the extra steps per the Oracle documentation.

References
https://support.oracle.com/CSP/main/article?cmd=show&type=NOT&id=1186342.1

Using DAC & Informatica to send proactive email alerts for OLTP or .CSV config file data issues that cause ORA-01452: cannot CREATE UNIQUE INDEX

It is possible that a DAC ETL load for an OBI Apps DW implementation can fail due to source system data or improperly maintained configuration files. As much as we hope that the business users and or the OLTP system itself remain error-free, this is not always the case especially when you take into account human errors (manual updates to key .csv config files) or OLTP data integrity issues (unstable source system, multiple external feeds to source system, improperly coded or outdated OLTP processes). Normally, if a DAC ETL load is scheduled to be nightly, the earliest notice will be sent by the DAC upon success/failure and no corrective action can be taken until the logs are traced and the business is notified to correct the OLTP or .csv file error(s) and the load most often needs to be restarted and the business will have lost that time.

To mitigate this risk, The DAC and Informatica can also be used to create a proactive email alert notification to allow the business or OLTP support team to correct any issues that may break the nightly ETL load. One common example of an avoidable OBI Apps ETL error is the notorious ORA-01452: cannot CREATE UNIQUE INDEX error. The DAC will issue a CREATE UNIQUE INDEX command to eliminate redundancies and ensure accuracies of the source system.

Step 1: Find the INTEGRATION_D ID that caused the UNIQUE INDEX ERROR via the following method replacing the W_XXX_D with the appropriate Target table from the error log

SELECT INTEGRATION_ID, DATASOURCE_NUM_ID, EFFECTIVE_FROM_DT, COUNT(*) FROM W_XXXX_D
GROUP BY INTEGRATION_ID, DATASOURCE_NUM_ID, EFFECTIVE_FROM_DT HAVING COUNT(*) > 1;

Step 2: Find the appropriate Source Qualifier extract SQL that is used for the mapping/mapplet that populates the target table (make sure to check for any SQ overrides at the session level). For example, the example below uses the SQ for the PeopleSoft mapplet C_mplt_BC_EmployeeDimension_Biography1. Use the same SQL concept as STEP1 to identify the exact records that are causing the downstream UNIQUE INDEX error by concatenating the fields that together may be used to create the INTEGRATION_ID downstream.


Using the above method should allow you to pinpoint the .CSV or the OLTP data anomaly that is causing the downstream Index Constraint.

Step 3: Create a simple Informatica Mapping/Session that uses the above formulated query to query the datasource (.CSV or a set of OLTP tables) depending on the source of the data issue. As a target, its best to create a .csv file in the same SrcFiles directory that is already defined on the INFA/DAC server. The mappings should populate the .csv file.


Step 4:
Create a Session based on mapping in Step 3 that populates the .csv target with the problematic rows and conditionally sends an email to the appropriate business users or OLTP system admins with an attachment of the problem records.

Step 5
: Create the associated DAC components (tables, tasks, execution plan) etc and schedule this as a separate execution plan that is run at the same frequency of the actual Load. Preferably the alert should go to the correct business users who maintain the config file or the OLTP system contacts who can correct the source system issue detected.

The above approach can be useful for OBI Apps implementations that have issues related to source system data and/or config file errors. It will proactively notify the business to take corrective action on data anomalies that can cause Execution plan failures due to ORA UNIQUE INDEX error.